Likert scale vs NPS: when to use each
Two ways to measure user satisfaction after a task: what each one measures, where it falls short and when to use each.
UX8 min read

While applying the user-centered design (UCD) methodology to a software project for the agency where I work as a UX Designer, we ran into many doubts and difficulties gathering requirements, because of the many stakeholders involved and how hard it was to reach them.
For software that adapts to the client's needs, we decided to add rating surveys at key points of the users' tasks, so the idea came out of necessity. Over a project that lasted 6 months, I was able to research and find a few solutions that helped me in the final delivery.
Even while using them, we started to feel more sure and confident about new features, without the damage caused by feature creep, the cause of all the mess. But let's leave that story for another article.
In this research I found two methodologies that worked very well for people who use software (also for blogs, websites and apps): the Likert Scale and NPS.
Even though all my research was done for software, apps and websites, I'll do my best to write for services, products and customer support too. Remember that this article is evolving, and any criticism or correction is welcome as good feedback and learning for me and for everyone who follows along. So, let's go.
Likert Scale, usually 5 to 7 points

by GetFeedback
You may not know what this is, but you have probably "bumped into" it on a website or app. The Likert Scale is a methodology for capturing user feedback after a given task, just like NPS (Net Promoter Score).
The Likert Scale, named after its creator, the American social scientist Rensis Likert, is one of the most reliable and popular ways to measure opinions, perceptions and behaviors. Unlike a plain "yes or no", the scale offers answer options at the extremes, such as “strongly agree” and “strongly disagree”, usually with 5 to 7 points.

by Budi Tanrim in Shipp
To use the Likert Scale properly and get a good measure of customer satisfaction, it should be made up of multiple questions (I recommend up to 5 questions, taking no more than 3 minutes for each user to answer). If you only want to use a single question, the right tool is NPS (Net Promoter Score), which I'll cover a bit further on.
What to measure with the Likert Scale?
A good point of attention: if you don't have simple questions for the user, you won't be able to measure anything. Some examples I've used:
- “How satisfied are you with our support?” — Terrible to excellent
- “Were you able to complete your task without difficulty?” — I couldn't to I could without difficulty
- “Thanks for using our service, would you recommend it to someone else?” — Never to definitely

Once customers provide the data on the site or app, we assess satisfaction for each task, service and support interaction. This makes the construction quantitative, while the survey gives us qualitative feedback. That way, the company can more clearly capture the intensity of the customer's feeling and build something around real data.
Pros and cons of the Likert Scale
Starting with how easy it is to build, the great advantage of the Likert Scale is also how easy it is to handle (reworking the artifact or service, content and user interest), since it's easy for a respondent to state a degree of agreement with any statement.
The disadvantage of the Likert Scale for the interviewer is the difficulty of deciding what to do with the neutral odd numbers. It can be normal for a user to pick the neutral option (the midpoint), a level between agreement and disagreement. Reliability is better on scales whose items are measured with more than 7 points, and drops when items have fewer than 5 points.

Once the questionnaire is complete (for the internet, I consider quarterly values), each item can be analyzed separately or as a set of items that can be added up, giving us a total value that will guide us to other solutions. In conclusion, we can have result options such as:
- Mean (neutral points): This is the bad side of the survey, since it will be hard to find the flaw in the artifact presented to the user.
- Median and mode: they give us more interesting metrics, an interpretation of the “agree” or “disagree” categories.
From these results we can calculate the mean, median or mode. The median and mode are the more interesting metrics, but interpreting the numerical mean of categories such as “agree” or “disagree” gives us no relevant information. In commercial surveys, the data are normally treated as an interval and not as ordinal data, although it's worth remembering that there is a broad methodological debate about this in the scientific literature.
NPS Scale, from 0 to 10 points

by GetFeedback
We can say that, given the difficulties associated with the Likert Scale, new scales were developed, and among them NPS (Net Promoter Score), a methodology created in 2003 by Bain & Company, proposes a standard scale from 0 to 10 points, usually taking less than 1 minute to answer, in a sequence of whole numbers where 0 is the worst possible level and 10 the maximum intensity. We can group these satisfaction levels as:
- 0 to 2: Very low;
- 3 to 7: Moderate;
- 8 to 10: Very high.
Even though on the internet you'll find many, I might even say almost most, using the Likert Scale with just one question, the NPS scale was developed precisely for that model.
What to measure with NPS?

by Igor Kozak for Rocketboy
As said above, NPS was designed to have just one question.
Even though it's only one, it's important to set a good criterion so you end up with a good answer about the user's journey, and it's up to the UX'er, designer or company to decide which stage of the product, service, support or task should be evaluated. The most common ones, which we're used to seeing (almost daily), are:
- Products: when you receive a product, it's normal to get an email with a notification asking you to take the survey. For a product like an appliance, it may be sent a few days later (as with the apps of Zoom, Magalu, Dafiti, among others). For food, it can be sent instantly (as with the apps of Ifood, Uber Eats, etc).
- Services: this is when the company has the chance, through an email or a pop-up (or modal), to ask the user to rate the service received. The goal is to find out their perception of the business or company.
- Support: for me, one of the cruelest. It's widely used by companies that want to evaluate one of the biggest sources of customer complaints.
Pros and cons of NPS
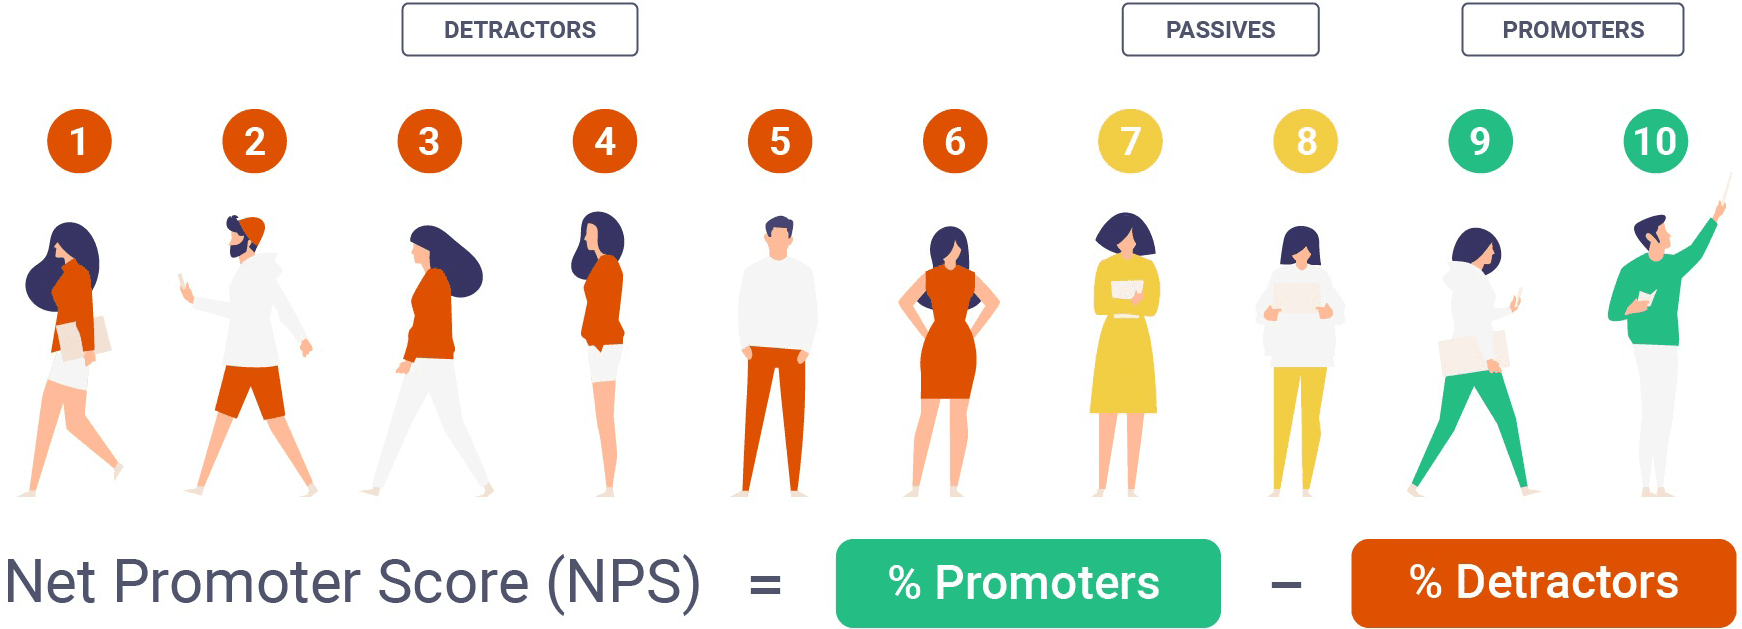
To understand the pros and cons of NPS, we need to classify our customers, and the methodology already gives us that. After collecting the 0 to 10 ratings given by users, we can split them (as seen in the image above by Joanna Jaroszczuk) into:
- Detractors: users who gave scores from 0 to 6.
They are unhappy with your product, service or support. - Passives: users who gave scores of 7 to 8.
They are satisfied and got what they expected. What's missing is the part where they're surprised or delighted. They will probably not be loyal users (or buyers). - Promoters: users who gave scores of 9 to 10.
These are the customers who were very satisfied, time to celebrate. They are the ones who talk about your product, service or support, generating what we could call "good free advertising", recommending you and even taking pride in being customers.
There are many advantages to using NPS: if you know well the personas who use the artifact, it will be agile, quick to build and implement, it is a good benchmark for large consultancies and research institutes, and it allows comparisons between services and companies.
The disadvantage has to do with the types of user: while a promoter can bring in new customers, a detractor can scare them away.
NPS sums these concepts up in a single metric (per question), calculated by subtracting the percentage of “detractors” from the percentage of “promoters”.
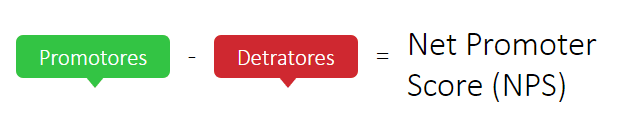
Calculating: if 75% of your customers are Promoters, 15% are Passives and 10% are Detractors, your Net Promoter Score will be 65%. From these results you can plan improvements to the service, product and/or support for the user.
In conclusion, the Likert Scale and NPS should be used according to the product, service, support and task you're developing.
**I hope you enjoyed it, and thanks for reading! 🤟🏼
**Follow me on Linkedin: https://www.linkedin.com/in/murilofsouza/
References
- https://www.questionpro.com/blog/pt-br/escala-likert/
- PMKT — Mensuração e Escalas de Verificação
- Gauss Consulting Group: https://gaussconsulting.com.br/blog/escala-de-likert-o-que-e-e-como-utiliza-la/
- Agendor: https://www.agendor.com.br/blog/modelo-de-pesquisa-de-satisfacao/
- Design Centrado no Usuário — Travis Lowdermilk
- Mandae: https://www.mandae.com.br/blog/nps-o-que-e-e-como-calcular-o-net-promoter-score/
- Survey Monkey: https://pt.surveymonkey.com/mp/net-promoter-score/
Originally published onMedium(opens in a new tab)
Keep reading
UX2025
Product2024